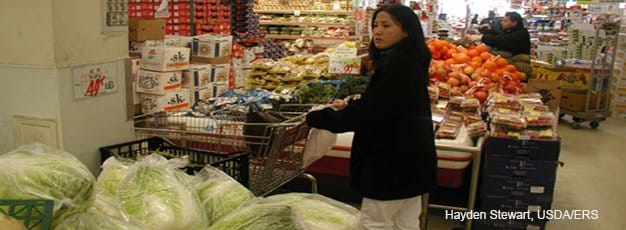
Lower Income Households Spend Additional Income on Foods Other Than Fruit and Vegetables

On average, Americans do not consume enough fruit and vegetables, despite the recommendations outlined in the Dietary Guidelines for Americans. The discrepancy between actual and recommended consumption is even larger for low-income households. They score below higher income households on healthy eating indices that range from 10 for full compliance with dietary recommendations to zero for no consumption. Households earning below 185 percent of the poverty line scored below those with incomes at or above this level on indices for whether enough fruit (about 3.5 versus 4) and vegetables (about 5.5 versus 6.3) are being eaten.
What if lower income households had additional resources? Would they spend more on fruit and vegetables? Food expenditures and food consumption are closely, though not perfectly, correlated. Food expenditures reflect quantities purchased as well as quality. Thus, a higher level of expenditures could reflect an increase in either the quantity or the quality of fruit and vegetables being consumed.
An ERS analysis of the 2003 Consumer Expenditure Survey looked at how small adjustments to lower income households’ buying power would affect their food spending. Households earning below 130 percent of the poverty line spent less money than other households on several types of foods bought for at-home consumption, including beef, dairy products, fruit, vegetables, bread and other baked goods, and frozen prepared foods. For example, these households spent 23 percent less on fruit and 17 percent less on vegetables than wealthier households.
| At-home foods | Income below 130 percent of poverty line | Income between 130 and 500 percent of poverty line |
|---|---|---|
| Per person weekly spending, 2003 dollars | ||
| Bread and baked goods | 2.22 | 2.67 |
| Dairy foods | 2.42 | 3.03 |
| Fruit | 2.06 | 2.67 |
| Beef | 1.66 | 1.98 |
| Frozen prepared foods | 0.90 | 1.03 |
| Vegetables | 1.99 | 2.39 |
| Notes: In fiscal year 2003, the poverty line was $18,660 per year for a family of four with two related children under age 18. All differences in expenditures between the two income groups are statistically significant at the 10-percent level. Source: Analysis by USDA, Economic Research Service, of the Bureau of Labor Statistics’ 2003 Consumer Expenditure Survey. |
||
The analysis found that households with incomes less than 130 percent of the poverty line will spend additional income on needs other than fruit and vegetables. Among the foods examined, the lowest income households were more likely to spend a small increase in income on beef and frozen prepared foods. These foods may be priorities over fruit and vegetables because of taste and convenience.
As incomes rise, households allocate additional income across a wider variety of foods. For households earning between 130 and 185 percent of the poverty line, some portion of a small increase in income will likely be spent on fruit and vegetables. Among such households, a 10-percent increase in income prompts a 1.2-percent and 1.9-percent increase in fruit and vegetable expenditures, respectively.
Are Lower Income Households Willing and Able To Budget for Fruits and Vegetables?, by Hayden Stewart and Noel Blisard, USDA, Economic Research Service, January 2008
The Healthy Eating Index: 1999-2000, USDA, Center for Nutrition Policy and Promotion, December 2002, CNPP-12.

